Changelog
Version 2021.282
What’s New
-
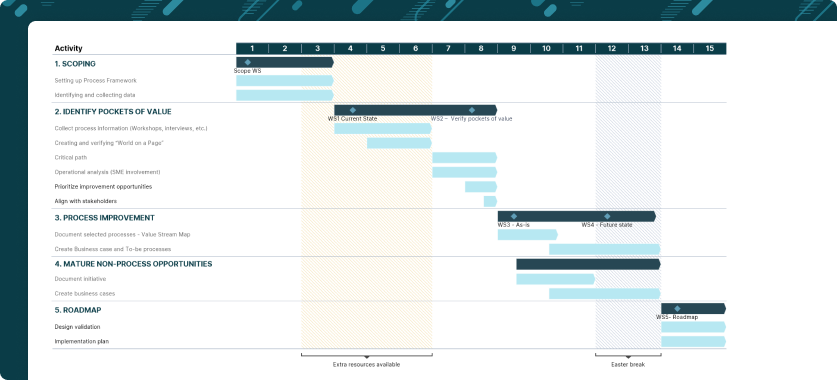
Brackets and shades in Gantt: Looking to highlight a period like a holiday in your Gantt chart? You can now add "brackets" with connected "shades" and customize how they should look. For now, brackets can only be placed in the footer row.
-
Empty labels were somewhat hard to find in Gantt previously. We've made them stand out a bit more.
-
You can now select and move columns in Gantt - just as you can with rows. Equality is nice - right?
-
Setting background color on a row in Gantt is often useful, so we added the possibility to do this as well.
-
We've added Stars as milestone shapes.
-
Improved date axis: The date axis is now a better version of itself. We've added the possibility to adjust the start and end date independently from your data and from each other, which is great for those long time series that keep expanding with a Greedy data connection. We've also improved automatic labeling and added support for "Day" as a unit. Finally, you can now control which date granularity "levels" you want to display by clicking the date axis and toggling on/off.
-
Improved value axis: The value axis has also gotten some upgrades. It's now way easier to see if a max or min value is in the automatic or manual mode, and much easier to reset it. Just select the axis, and reset buttons will appear for all settings that are not in an automatic mode.
-
We polished the menus for highlights a bit. They're now looking nice and shiny.
-
What sign (+/-) should a percentage change from a negative to a positive value have? We think + makes the most sense, so we've updated the highlight calculations in charts to reflect this. (For the math heads out there, we now divide by the absolute value).
-
When using markers in line charts, we've noticed that many want the marker color to be the same as the line color. So we added an option in the color picker to "Link color to line", and set this as the new default. You can still choose any color you want though, of course.
Bug fixes
- Using the column and row resizing menu in Visual Grids was not great if you were connected to an external monitor. Often the menu was a bit of a tease, disappearing just when the mouse was hovering over it. We've taught it some manners and told it to stay put for you.
- In some rare cases, moving the data editor from one screen to another external screen would trigger a crash. That shouldn't happen, so it doesn't anymore.
- We improved robustness in file reading from Sharepoint and OneDrive, making it work in some situations where it didn't before.
- Up till now it has been possible to establish connections to unsaved Excel workbooks. That doesn't make much sense, so we removed that option.
- When converting Grunts to PPT shapes, we used to add an empty text box for all cells. That' didn't make much sense, so we stopped doing that.
- Fixed: Highlight arrows sometimes looked bad when converted to PPT shapes.
- Fixed: Drag-to-duplicate objects with Smart selection On would appear in the wrong position.
- Fixed: Templates were inserted with the date and number format of the creator, not the user inserting it.
- Toggling off "Paste as Grunt" would break copy/pasting of existing Grunt objects. It now works as expected, only affecting behavior when copy/pasting ranges from Excel.
- Fixed: Processes in Gantt would sometimes stack where they weren't supposed to.
- Fixed: Milestones in Gantt would occasionally skip a day forward or backward when drag-moved.
- Fixed: Label text boxes in Gantt would be as long as the longest in the column.
- Right-click on Gantt rows and columns is now working again.
- Fixed: Level difference connector points were offset when on the left side in line charts.
- Fixed: In some rare cases for some older charts, the axis titles could not be turned on.